Wyckoffanalytics – Point and Figure Part II Projecting P& F Price Targets Across Multiple Time Frames
Original price was: $299.00.$44.00Current price is: $44.00.
»Instant Delivery
Description
Wyckoffanalytics – Point and Figure Part II Projecting P& F Price Targets Across Multiple Time Frames

Description of Point and Figure Part II Projecting P& F Price Targets Across Multiple Time Frames
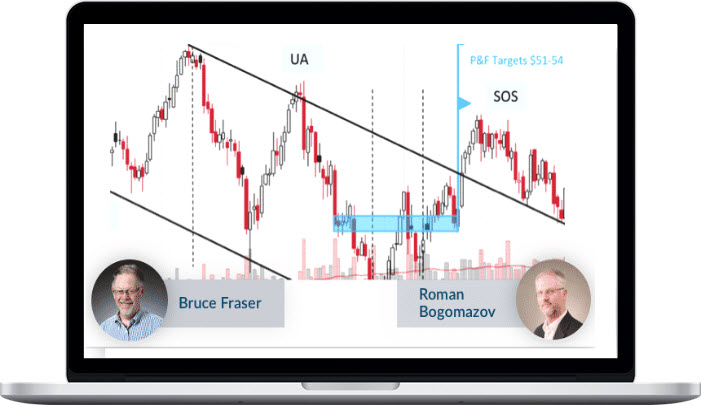
Projecting Point-and-Figure Price Targets Across Multiple Time Frames, Bruce Fraser and Roman Bogomazov provide detailed instructions on how to create and use Wyckoff-based P&F charts to estimate realistic price targets. Anyone who has seen Bruce’s P&F analyses knows how, when properly done, this technique can identify future price objectives with uncanny accuracy.
This course builds on the methodological foundations presented in our on-demand P&F Part I: Setting Price Targets Using Wyckoff Point-and-Figure Projections. However, Part II is based on entirely new material. Traders who purchased Part I will gain new practical insights as well as a much deeper understanding of this approach.
Each of the three sessions in Part II is devoted to a specific time frame:
- Long-term campaigns [months to years],
- Swing trades [weeks to months], and
- Intraday [hours to days]).
Bruce and Roman present the materials as case studies that start with a blank P&F chart and then, as the chart unfolds over time, show you their step-by-step process for taking and projecting horizontal counts.
In this webinar series, they demonstrate — for the first time — how to analyze the directional bias of a trading range based on P&F analysis alone, as well as how to enhance the quality of your P&F analysis by incorporating trading volume. They introduce new concepts through the case studies, and revisit the fundamentals of P&F horizontal counting.
What will you learn in Point and Figure Part II Projecting P& F Price Targets Across Multiple Time Frames?
Including how to:
- Create and annotate Wyckoff-style P&F charts
- Correctly identify the count line in a variety of trading range configurations
- Designate P&F phases sequentially and project price targets from each
- Anticipate the resumption of a trend based on confirming counts of re-accumulation and re-distribution trading ranges
- Manage trades once price approaches P&F-based price targets
![]()
More courses from the same author: Wyckoffanalytics
Delivery Policy
Block "shipping-policy" not found
Related products